Using the dashboard
How to read DealerPricing Insights
Updated 3 September 2026 · 1 min read · by DealerPricing
The Insights tab scores the market for the car you searched. Market Rating out of 10 summarises demand, supply and turnover. Active Supply is how many similar cars are for sale now; Recently Sold is how many went in the recent period; Avg Days to Sell is the median time on sale. Demand, Competition and Turnover put those numbers into words.
Step by step
Check the summary on the Pricing tab
The Insights card gives the market rating and average days to sell at a glance.
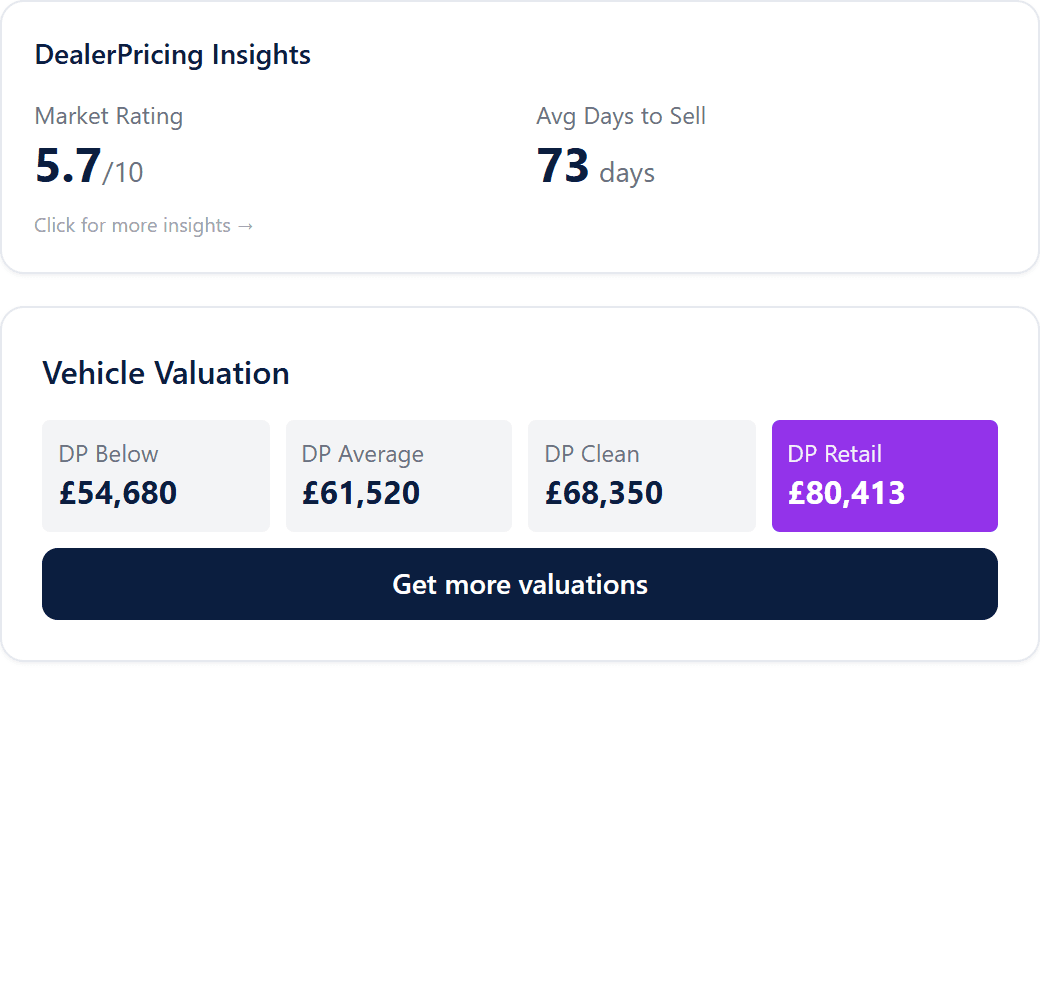
Insights summary card with market rating 5.7 out of 10 and 73 days to sell Open the Insights tab
The full view adds active supply, recently sold, demand, competition, turnover, key insights and the share of similar cars that sell within a given number of days.
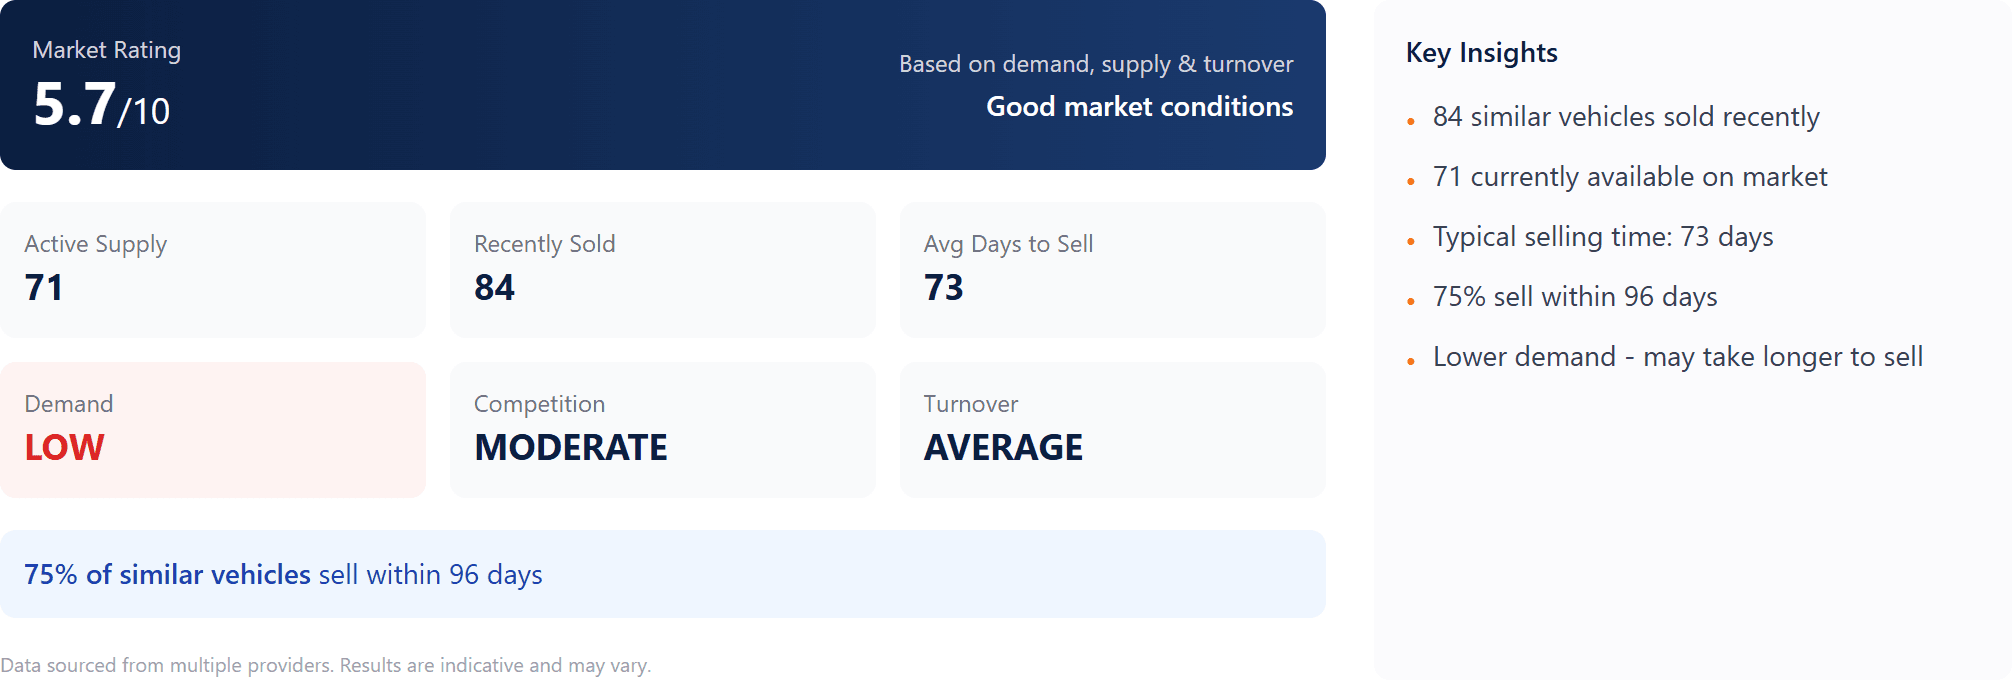
Insights tab: market rating 5.7/10, active supply 71, recently sold 84, 73 days to sell, demand low, competition moderate, turnover average, plus key insights
What you’ll see
- Market Rating out of 10 with a plain-English verdict
- Active Supply, Recently Sold and Avg Days to Sell
- Demand, Competition and Turnover levels
- The percentage of similar vehicles that sell within a set number of days
Ready to try it?
Already a member? Log in and open the dashboard.
Get started with DealerPricing →Frequently asked questions
What is a good market rating?
Above 7 is a strong market: high demand, manageable competition and fast turnover. Below 5 means the model is slow or oversupplied, so buy cheaper and price sharper.
How is days to sell calculated?
From the time comparable listings spent on sale before they were removed as sold, using the median so a few very slow cars do not distort it.